The Danube water quality between Bratislava and Visegrád (1989-1997)
Jarmila MAKOVINSKÁ
CONCLUSIONS The water quality was evaluated separately for the conditions before and after start of the Gabčikovo Project. According to the water temperature, dissolved oxygen, hardness, alkalinity, chlorides and sulphates, the Danube water corresponds to the class I. The Project operation did not cause any significant changes in these parameters. In the area of Medveďov, the suspended solids content has decreased due the sedimentation in the Čunovo reservoir. Organic load tends to decrease. Similarly, the water quality improved substantially in terms of several forms of nutrients. However, the nutrient level in the Danube continues to be relatively high and is sufficient to support the growth of phytoplankton. Thus, according to the nutrients level, the water satisfy the criteria of the quality classes III-IV. According to the organic micro-pollutants level, the water quality ranges mostly from the II. to III. class, while according to the polychlorinated biphenils from the III. – IV. class. With respect to inorganic micro-pollutants, the water quality mostly corresponds to the I class. An increased level of mercury was recorded in Bratislava and in the stations downstream from Bratislava, according to this, the water quality ranges from I to IV class at all stations. The total number of heterotrophic bacteria tended to decrease in the whole section examined. According to coliform bacteria the water quality ranges from the IV. to VI. class. According to the saprobic index and bioseston, the water quality ranges from the III. to IV, class. The chlorophill-a level indicates a decreasing of phytoplankton biomass. The saprobic index of periphyton ranged from 1.70 to 2.33, shoving the increasing of organic pollution et Szob. The macrozoobenthos composition was influenced by the species drifted from the left sided tributaries. The water exhibited mostly the β-mesosaprobity.
INTRODUCTION
The programme for the extended joint water quality measurements and assessment of the Danube section between Bratislava and Visegrád started in April 1989, on the basis of the approval of the plenipotentiaries of Slovakia and Hungary. The extended water quality monitoring was evaluated annually. This evaluation served as a basis for modification proposals reflecting the new findings from the on-going monitoring programme and the changing environmental conditions in the study area, e.g. putting the Gabčíkovo structures into operation in 1992. All proposed modifications in the extended monitoring programme were annually discussed by plenipotentiaries for the transboundary waters of the parties. For water quality changes documentation of the Danube in the section Bratislava-Visegrád for the period 1989-1997, the bilaterally discussed and confirmed data of the jointly harmonised monitoring programme have been used. The evaluation - owing to the limitations - could not cover all possible factors (e.g. hydrological conditions, changes in wastewater treatment etc.).
Some results of the extended monitoring of the Danube in the section Bratislava - Visegrád have been published [5, 6, 7, 9, 10, 11, 12, 13, 16]. Results of the joint Slovak-Hungarian monitoring programme for the period 1989 - 1995 have been summarised by Makovinská and László [17].
The water quality in the Danube in the Slovak section has been evaluated in three papers [1, 18, 21]. These papers, based on the calculation of nutrient concentration ratio, showed phosphorus to be the major limiting factor for the development of phytoplankton biomass in the Danube and in the Čunovo reservoir.
MATERIAL AND METHODS
Monitoring carried out in the Danube from April 1989 to December 1997 was done regularly in two-week intervals except for 1991 when the measurements were done from January to April. The regular monitoring included the following groups of parameters: physical-chemical parameters, nutrients level, organic and inorganic micro-pollutants, indicators of radioactivity, microbiological and hydrobiological parameters. Some special parameters were monitored quarterly and in a reduced number of sampling sites. All sampling sites are listed in the Tab.1.
The limit values of the water quality classes are given in Tab. 12. These values, based on the statistical evaluation (90 percentiles and means), correspond to the 6-class water quality classification scale of the former COMECON and to the proposals of the European Economic Committee. Tables 2 –11 contain 90 percentile values of selected parameters.
The linear regression was used to characterise the trends in the water quality in the Danube during the whole monitoring.
RESULTS AND DISCUSSION
Physical and chemical characteristics
The water temperature of the Danube depends directly on climatic conditions. The 90 percentile value of the water temperature of the section between Bratislava and Visegrád showed certain rising trend. In the period 1989-1997, the Danube water in the section Bratislava-Komárom/Komárno was classified, according to the 90 percentile value of temperature, into class I. The water in the section Szob-Visegrád was classified in the class II in the period 1989-1995, but in the last two years to class I (decrease of temperature). The Gabčíkovo Project operation did not cause any significant changes in the temperature conditions.
The transparency of the Danube water was low due to the high content of suspended solids. This constrains the photosynthetic activity of the producers. The mean value of transparency ranged from 200 mm to 300 mm, the maximum from 300 to 500 mm, while the 90 percentile values ranged from 250 to 432 mm. The longitudinal variation of transparency was insignificant. This equally refers to the periods before and after damming.
The maximum content of suspended solids changed by several hundreds mg/l during the past nine years. The 90 percentile values (Tab. 2) characterises a more uniform variation. In the section of Medveďov/Vámosszabadi, the suspended solids content has substantially decreased due to the sedimentation in the Čunovo reservoir. The remarkable differences between the suspended solids content in the section Bratislava - Medveďov/Vámosszabadi can be clearly demonstrated by the data from 1993 - 1997.
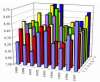
The pH values (Fig.1) tended to slightly increase in the section Bratislava - Szob. The pH values culminated in the growing season due to the growth of the phytoplankton increase chlorophyll-a level.
The 10 percentile values of dissolved oxygen reached 8.0 mg.l-1 in all monitored sites. Therefore, the water was classified into class I. This statement refers to the whole period 1989-1997.
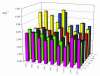
Statistical characteristics of organic pollution are characterised by the BOD5, CODMn, CODCr and organic carbon. They indicated a substantial improvement in the water quality in the Danube in 1989-1995. In 1996, organic load slightly increased, however in 1997 decreased again (Tab. 3, Fig.2). The trend of these parameters indicated a decrease in organic loads. This phenomenon resulted from substantial waste water treatment investments in the countries (Germany, Austria) in upper Danube as well as in the Danube river basin in Slovakia and Hungary. In the whole monitored section, the CODCr /CODMn ratio varied within a relatively narrow range, indicating the stable proportion of components which are more heavily and/or readily degradable.
Parameters of the organic pollution (CODMn, CODCr) indicated differences in water quality in the cross section at Szob (Tab.4 Fig. 3). The level of organic pollution at the Szob left bank was higher than that in the river middle or at its right bank.
During 1989-1997 the Danube water quality was classified into class I, based on the hardness, alkalinity, chlorides, and sulphates which form the total of dissolved solids.
Nutrients
The nutrients content in the Danube water was relatively high and sufficient to support the growth of phytoplankton. Similarly to parameters of organic pollution, the water quality was substantially improving also in terms of several forms of nutrients (ammonium, ortho-phosphate and total phosphorus) during the nine year of monitoring.
Ammonium levels, ortho-phosphate and total phosphorus levels have been slightly decreasing in the whole monitored section, probably due to waste water treatment in the upstream countries. The 90 percentiles of the ortho-phoshates and total phosphorus also decreased (Tab.5, 6; Fig.4). The 90 percentile values of nitrates and total nitrogen were slightly increasing (Tab.7, 8). These trends also indicated a slight increase or stability of the mentioned parameters, causing the increase of N:P ratio. The largest part of total nitrogen in the Danube was represented by the nitrate.
The Danube water was classified into the water quality class III-IV in terms of ammonium, nitrite, nitrate, ortho-phosphate and total phosphorus (based on the 90% values), while the total nitrogen (based on the mean values) qualified it into class V. The cross-sectional variation of ammonium at Szob was similar to that observed in the organic pollutants. The water quality was worse at the left bank than in the middle or at the right bank.
Seasonally, ammonium levels were higher during the periods of low water temperature, due to the slowing down of the nitrification processes.
Organic micro-pollutants
Among the organic micro-pollutants in the Danube, the phenols, anion-active detergents and oils were measured in two-week intervals. Among the pesticides, the insecticide Lindane, a chlorinated hydrocarbon product, and the triazin-typed herbicide Atrazin were measured.
The Danube was classified into the water quality class II, based on the 90 percentile value of phenols and anion-active detergents, but in some monitoring sites the recorded maxima of anion-active detergents were below the limit values of class II.
The 90 percentile values of oils (petroleum hydrocarbons - UV) ranged from 0.034 to 0.112 mg/l in the section between Bratislava and Visegrád. These values corresponded to the water quality class III (Tab 9). No remarkable differences were detected along the section between Bratislava and Visegrád. In 1989-1997 the oil content slightly increased in the section between Bratislava and Komárom/Komárno, while in other sites tended to decrease (Fig. 5).
The Lindane levels in the Danube ranged from 1 to 1600 ng/l. The highest levels were recorded at Bratislava. High levels of Lindane were recorded in the first part of the monitoring. Maximum values corresponded, generally, to the water quality class III.
The Atrazin levels, a herbicide used in large quantities over the agricultural areas in the Danube basin, ranged in the Danube from 1 to 1100 ng/l. The highest level was recorded at Bratislava. During last two years, the maxima and 90 percentiles of Atrazin levels were lower than earlier in all sampling sites.
The chloroform levels, measured as a representative component of the group of volatile chlorinated hydrocarbons, ranged within wide limits of 50 - 50000 ng/l. The highest values were recorded at Rajka.
Polychlorinated biphenyls (PCBs) level ranged from 1 to 765 ng/l. Out of this range, the only extremely high level was recorded at Szob (2 221 ng/l). The mean levels, as a basis for classification for PCBs, corresponded to the water quality classes III-IV .
Analyses of organic micro-pollutants were complemented with GC-MS qualitative measurements for three sites in the Danube. The organic micro-pollutants were either quantified or only qualitatively identified. Several aliphatic hydrocarbons, phthalates, phenols, chlorinated hydrocarbons and hetero-compounds containing sulphur and nitrogen atoms were identified in these waters. Some of the above listed compounds adversely affect the human health and the aquatic biota, while other are less important from the eco-toxicological view point.
Inorganic micropollutants
Ten different metals and trace elements were monitored in this group. The Danube has a good oxygen conditions. Therefore iron occurs mostly in a less soluble oxidised form, attached to suspended solids. According to iron level, the Danube water corresponds to the quality classes I-II. The iron levels ranged from 0.05 to 3.00 mg/l. Similarly, manganese was also present mostly in the solid phase, attached to suspended solids. The manganese levels ranged from 0.01 to 0.30 mg/l, these values corresponded to the water quality classes I-III.
The 90 percentiles of zinc did not exceed the limit values of the class I (0.2 mg/l) during whole monitored period. Copper was also present in low levels in the Danube water (class I), as well as chromium. Levels of chromium were lower than 20 mg/l, the limit value of water quality class I. Lead exceeded 10 mg/l, the limit value of water quality class I, in the section between Medveďov/Vámosszabadi and Szob in 1989-1995. The observed range of 10-15 mg/l corresponds to class II. During last two years, lead did not exceed water quality class I at all monitored sites. Cadmium levels were substantially lower than 3 mg/l, the limit value of class I in the Danube. The highest recorded value was 3.2 mg/l, however during 1996-1997 recorded values did not exceed 1.0 mg/l.
The level of mercury, the most toxic heavy metal, ranged in limits (<0.1-3.2 mg/l). The highest levels were recorded at Bratislava, Rajka, Komárom/Komárno and Szob, but in a very low frequency. During 1989-1997, in all sites, the 90 percentile values were below 1 mg/l within limits for the water quality classes I-IV. The reason of such amount of mercury in the Danube is not fully clear and a detailed study of the relationships between geological bedrock, water-suspended solids, aquatic biota and antropogenic activities is to be done.
The nickel levels were everywhere lower than the limit value of class I. The arsenic levels ranged from a few tenth of mg/l to 2 mg/l. The 90 percentile values of the monitored section corresponded to water quality class I. Higher levels at the left bank in Szob (90 percentile value - 5,3 mg/l) were caused by the water from the Hron river.
Radioactivity
Characteristic values of total beta activity in the Danube were equally of an order of 100 mBq/l. In 1994, however, a single value of beta activity exceeding 1000 mBq/l was recorded at Bratislava at the left bank and in the river middle. No causes of this extreme value were identified. Time series of the total beta activity in the Danube tended to slightly decrease during the nine year monitoring (Fig.6).
Cesium-137, the only component of the gamma spectrum in the Danube exceeding the detection limit, was of an order of 1 mBq/l in all sites investigated.
A few mBq/l characterised Strontium-90, total beta activity, in the Danube. Concentrations of tritium was in the range of 1-10 Bq/l.
Microbiological pollution
The number of bacteria in the Danube was relatively high due to a quite high content of biodegradable organic matter. Consequently, the heterotrophic bacteria had a key role in the process of degradation of organic matter in the aquatic system.
The total number of heterotrophic bacteria was represented by the psychrophylic bacteria. The time series show a decreasing trend during the nine year monitoring, and decrease in the recorded values along the monitored section as well (Fig. 7). Significant reduction of heterotrophic bacteria between Medveďov/Vámosszabadi and Szob where caused by sedimentation processes in the Čunovo reservoir.
The coliform bacteria indicate a faecal pollution. Statistical values (90percentiles) showed a decreasing trend of coliform bacteria in the section Medveďov/Vámosszabadi - Visegrád during the monitored period (Tab.11). According to the coliform bacteria the water quality corresponded to class IV-VI.
Stability of the recent faecal pollution has been documented by faecal coliform bacteria (water quality class III-V, based on mean values), however, the range of measured values from Bratislava to Medveďov/Vámosszabadi was lower than at sites downstream of Medveďov/Vámosszabadi.
On the base of mean values of the faecal streptococcae, which indicate the former contamination, the examined samples belonged to the classes IV-V. Measured levels of faecal streptococcae were slightly increased or stabilised at all sampling sites, except for Medveďov/Vámosszabadi, exhibiting a slightly decreasing trend during 1989-1997.
Principally, Clostridia are not waterborne bacteria, but their increase can be explain by the strong soil transport to the water body via runoff. There was no significant trend of occurrence of clostridia quantity during the nine year monitoring. However, maximum levels were typically recorded during floods at all sampling sites in the Danube.
Hydrobiological investigation
Saprobic index of bioseston
Pantle-Buck saprobic index of bioseston ranged from 1,86 to3,34 in the Bratislava-Visegrád section. The minimum values (1,86-2,3) corresponded to the beta-mesosaprobic state, the maximum values (2,58-3,34) indicated alpha-mesosaprobic status. Time series of saprobic index show a slightly decreasing trend during the nine year monitoring (Fig. 8). According to the mean and 90 percentile values, saprobity has not significantly changed along the Danube (Tab. 10).
In terms of quality classes, the sampling sites belonged to the water quality class III-IV. The evident decrease of the maxima of saprobic index in the second period of the monitoring corresponded to the quality class III at all sites.
Phytoplankton
The evaluation of the phytoplankton during 1990-1997 is given by Makovinská & Hindák (this issue). The species diversity of the investigated section of the Danube is very high (263 genera, 1063 species a 106 varieties and forms).
The mean abundance of phytoplankton slightly decreased at Bratislava, Rajka, Medveďov/Vámosszabadi and Komárno/Komárom. The abundance increased along the monitored section. These phenomena were the most evident in 1995 and 1997.
The chlorophyll-a levels indicated an obvious decreasing trend in phytoplankton biomass. This trend was weaker in the section Bratislava-Hrušov than in the section Medveďov/Vámosszabadi - Visegrád.
Zooplankton
Altogether 154 zooplankton species were found in the Danube, almost all of them belonging to the Rotifers (95 species). The Copepods (20 species) and the Cladocerans (39 species) were represented by a small number of taxa.
The dominant and frequent species were Brachionus angularis, B. calyciflorus, Filinia longiseta, Keratella cochlearis, K. cochlearis tecta, Polyarthra vulgaris, Acanthocyclops robustus f. limnetica, Bosmina longirostris. Many faunistically interesting taxa were found in the monitored section during 1993-1997 (e.g. Agronotholca foliacea, Brachionus plicatilis, Dicranophorus forcipatus, Elosa worallii, Euchlanis deflexa, E. lyra, Lecane flexis, L. ungulata, L. stokesi, Notholca lyra, Ploesoma mucronata (Rotatoria), Arctodiaptomus bacillifer, Eudiaptomus vulgaris, Eurytemora velox (Calanoida), Bosmina coregoni, Leptodora kandtii, Macrothryx laticornis, M. rosea, Moina brachiata, Pseudochydorus globosus).
The community was poor in species in Bratislava, but species richness increased downstream along the Danube. Species composition did not change. Littoral or stagnant water species occasionally occurred in the middle of the river. The zooplankton abundance increased along the Danube, but the community structure was very similar at different sites (Fig. 9). Maximum densities of zooplankton, with two annual peaks, were found in Szob and Visegrád.: The first peak was larger and occurred in spring and early summer, the next occurred at the end of summer and in autumn. The increasing abundance of zooplankton along the Danube also indicated changes in the river flow characteristics and the non significant increasing of zooplankton quantity towards eutrophication state.
Periphyton
From 1997, the sampling of periphyton algae started. The algae were sampled three times a year in selected sites (Bratislava, Rajka, Hrušov, Medveďov, Komárno and Szob. The saprobic indexes of periphyton ranged from 1.70 to 2.33. The analyses showed the increasing of organic pollution along the studied section from Bratislava to Szob.
Among the periphyton algae, the diatoms dominated in all sites (mainly Aulacoseira, Cyclotella, Cyclostephanos, melosira, Diatoma, Fragilaria, Achnanthes, Cocconeis, Amphora, Cymbella, Gomphonema, navicula, Rhoicosphaenia, Nitzschia). Filamentous blue-green algae (Oscillatoria, Phoprmidium) occurred very rarely. The euglenoids were present in the samples from Komárno/Komárom and Szob. Species composition of the periphyton at Hrušov was different. The green filamentous algae Cladophora glemerata dominated here together with their above mentioned diatom species.
Macrozoobenthos
The regular monitoring of macrozoobenthos communities in the Danube in the section Bratislava - Visegrád started in 1995. The sampling sites were selected according to suitable sampling conditions allowing to characterise the entire monitored section.
In the past, the most complex research on the benthic fauna was carried out by Brtek & Rothschein[3], recently the benthic fauna in the Danube was studied by Ardó [2], Košel [8], Makovinská & László [17], Šporka Šporka & Krno [20]. Csányi [4] studied the zoobenthos in the Slovak-Hungarian section of the Danube
The Danubian permanent benthic fauna consisted of sponges (Porifera), hydroids (Coelenterata), moss-animals (Bryozoa), flatworms (Turbellaria), roundworms (Nematoda), oligochaetes (Oligochaeta), bristle worms (Polychaeta), leeches (Hirudinea), molluscs - snails and mussels (Gastropoda, Bivalvia), water spiders and mites (Aranaea, Hydracarina), crustaceans (Crustacea) and insects - water bugs and beetles (Heteroptera, Coleoptera). Larvae of mayflies (Ephemeroptera), stoneflies (Plecoptera), dragonflies (Odonata), waterbugs (Heteroptera), beetles (Coleoptera), caddis flies (Trichoptera), midges (Chironomidae) and other Diptera developing in aquatic or semiaquatic biotopes represented the temporary fauna. The list of the recorded taxa is given by Elexová [5].
In total, 144 taxa of 18 systematic groups were found in the Danube sampling sites. This documented the high diversity of the Danube benthic fauna. Upstream from Bratislava, we found 72 taxa; among which Oligochaeta, Crustacea and Chironomidae dominated. Stylodrilus heringianus were attached to the gravel substrate and Tubifex sp. prevailed among oligochaetes. They caused an increase in the saprobity index. Among midges, the rheophilous Cricotopus bicinctus and C. triannulatus (Orthocladiinae) were dominant. The Ponto-caspian crustaceans - Dikerogammarus haemobaphes, D. bispinosus and Corophium curvispinum (except Jaera istri) and the bristle worm Hypania invalida were abundant. The occurrence of mayflies (7 taxa) and caddis flies (10 taxa), especially the presence of the stoneflies Leuctra fusca and L. hippopus only in this area, reflected a low degree of pollution and a relatively high flow velocity in the Danube. L. fusca is the only autochtonous stonefly occurring in the lower Danube in Slovakia. The occurrence of L. hippopus in the Danube has not been mentioned so far. The caddis fly Hydropsyche incognita was also present in our samples. The occurrence of the New Zealand snail, Potamopyrgus antipodarum is very interesting, as the species was introduced to the Danube probably by shipping through the Danube-Main-Rhine canal.
The lowest number of taxa was found downstream of Bratislava. This may be connected with waste water outlet from both the Slovnaft refinery and the Bratislava agglomeration. The pollution could be demonstrated by the prevalence of leeches of the genus Erpobdella and oligochaetes (genera Limnodrilus and Tubifex) that are resistant to chemical pollution and decrease in dissolved oxygen level. Among the mayflies, the representatives of the potamophilous Caenis genus, especially C. luctuosa (highly tolerant of pollution) were found. C. pseudorivulorum was also present, but it was not recorded downstream of Bratislava as far as Gabčíkovo. This was probably caused due to the Gabčíkovo structures. The number of caddis fly taxa was also reduced. Downstream of Bratislava, the absence of rheophilous insect larvae was caused by a substantial decrease in water flow velocity. In addition to the crustaceans sampled upstream of Bratislava, the Ponto-caspian Limnomysis benedeni also occurred downstream of Bratislava. The occurrence of the oligochaetes Limnodrilus hoffmeisteri, Potamothrix moldaviensis and of the caddis fly Psychomyia pusilla was also confirmed here.
The number of taxa was high (over 60) in the sites downstream of Komárno. As for abundance, rheophilous oligochaetes, bristle worms and midges dominated (Stylodrilus heringianus, Hypania invalida and the genus Cricotopus). Crustaceans (5-7 taxa) represented by Corophium curvispinum, Dikerogammarus bispinosus, D. haemobaphes and Pontogammarus obesus dominated. Gammarus roeselii, Ceratopogonidae larvae and the Potamanthus luteus mayfly, relatively resistant to pollution, probably migrated from the Danube tributaries. Other Ponto-caspian species like the snails Fagotia (Microcolpia) acicularis, Litoglyphus naticoides, Theodoxus danubialis, Dreissena polymorpha and the crustacean Limnomysis benedeni occurred in our samples. Among mayflies, the commonly occurring species of the Baetis and Caenis genera and Heptagenia sulphurea (a species highly tolerant of pollution) were recorded. We have not confirmed the mass occurrence of Heptagenia flava, rare H. coerulans and Ephemerella ignita. The regular occurrence of the rare species Ephemera lineata and Ephoron virgo is very interesting. The species with narrow ecological tolerance disappeared due to water quality deteriorating. The regular presence of the mentioned species in our samples documents an improvement of the Danube water quality. Among Trichoptera, Hydropsyche contubernalis and H. bulgaromanorum dominated in our samples.
Downstream of Szob, we found a snail typical of sand-mud habitats - Viviparus acerosus and big mussels of the Pseudanodonta, Anodonta and Unio genera, which were also recorded upstream of Komárno. U. crassus and the left-winding Physella acuta were also found. We have not confirmed the occurrence of the species Asellus aquaticus, Glossiphonia complanata or species of the Chaetogammarus genus in the Danube. Apart from the snails Theodoxus danubialis, Fagotia (Microcolpia) acicularis that ocurred commonly in our samples, another Ponto-caspian species, namely F. (Esperiana) esperi and Theodoxus fluviatilis recorded by Csányi [94] were not recorded during our sampling period.
It was shown that the macrozoobenthos community composition in the Danube between Bratislava and Visegrád was influenced by the species occuring in the Slovak left side tributaries. The water quality in the investigated section of the Danube was characterised by b-mesosaprobity, except the sites situated downstream of the Bratislava agglomeration and the waste water outlet of Slovnaft oil refinery, where it attained a-mesosaprobity.
REFERENCES
[1] Ardó, J. 1995. Vývoj kvality vody Dunaja pred a po prehradení koryta Dunaja v Čunove. Medzinár. konfer. Ekológia Dunaja, Stupava, pp. 140-144.
[2] Ardó, J. 1996. Hraničné toky s Rakúskom v roku 1995 (Dunaj-Morava). Final report VÚVH, Bratislava.
[3] Brtek, J. & Rothschein, J. 1964. Ein Beitrag zur Kenntnis der Hydrofauna und des tschechoslowakischen Abschnittes der Donau. Biol. Práce SAV 10:1-61.
[4] Csányi, B. 1994. Hydrobiological research of the Danube between Rajka and Budapest. I. Macrozoobenthon, pp. 713-719. In: Hegedüs, M. (ed.) XVIIth Conference of the Danube countries on hydrological forecasting and hydrological bases of water management - Proceedings Vol. II, Hungarian National Committee for UNESCO & WMO, Budapest.
[5] Elexová, E. 1998. Interaction of the Danube river and its left side tributaries in Slovak stretch from benthic fauna point of view. Biologia, Bratislava, 53: 621-632.
[6] Hindák, F. & Makovinská, J. 1996. Use of algae for monitoring rivers in Slovakia. In: Whitton, B. A. & Rott, E. (eds) Use of algae for monitoring rivers II. Proceedings of an International Symposium, Insbruck, Austria, pp. 133-136.
[7] Hindák, F. & Makovinská, J. 1998. Phytoplankton of the Danube River from Bratislava (Slovakia) to Budapest (Hungary). v tlači.
[8] Košel, V. 1995. Ripálny makrozoobentos Dunaja pred a po sprevádzkovaní vodného diela Gabčíkovo, pp. 123-131. In: Výsledky a skúsenosti z monitorovania bioty územia ovplyvneného vodným dielom Gabčíkovo, Ústav zoológie a ekosozológie SAV, Bratislava.
[9] Makovinská, J. 1994. Planktonic green algae of the River Danube from Bratislava Slovakia) to Szob (Hungary). Biologia, Bratislava, 49: 539-545.
[10] Makovinská, J. 1995. Primárna produkcia fytoplanktónu Dunaja, dvoch ramien inundačného územia a zdrže Hrušov. Zborník z konf. Výsledky a skúsenosti z monitorovania bioty územia ovplyvneného vodným dielom Gabčíkovo, Bratislava, pp. 227-235.
[11] Makovinská, J. 1998. Phytoplankton development of the Čunovo (Hrušov) Reservoir in the Danube river (Slovakia) during 1995-1997. Biologia, Bratislava, 53: 499-502.
[12] Makovinská, J. & Ardó, J. 1994. Water quality of the Danube section Bratislava - Visegrád. In: Proceeding XVIIth Conference of the Danube Countries on Hydrological Forecasting and Hydrological Bases of Water Management, pp. 707-712.
[13] Makovinská, J. & Ardó, J. 1996. Tendencie a dynamika zmien v kvalite vody Dunaja v rokoch 1989-1995. Vodohospodársky spravodajca, Bratislava, 10: 5-7.
[14] Makovinská, J. & Hindák, F. 1998. Use od algae for monitoring rivers in Slovakia: recent development. in press.
[15] Makovinská, J. & Hindák, F. 1999. Fytoplanktón Dunaja v úseku Bratislava-Visegrád v rokoch 1990-1997, in press.
[16] Makovinská, J. & Topoľská, J. 1996. Development and modelling of Eutrophication of the Čunovo Reservoir. In Proceeding of the XVIIIth Conference of the Danube countries, Graz, Austria, pp. 26-30.
[17] Makovinská, J. & László, F. 1997. Tendency and dynamics of water quality changes of the Danube River and its tributaries (1989-1995). Práce a štúdie 134, VÚVH, Bratislava, 115 pp.
[18] Rončák, P., Adamková, J. & Borovičková, A. 1995. Sledovanie vplyvu VDG na kvalitu povrchových vôd. Medzinár. konfer. Ekológia Dunaja, Stupava, pp. 145-151.
[19] Šporka, F. 1994. Klasifikácia pôvodných vôd inundačného územia Dunaja v slovensko-maďarskom úseku na základe fauny máloštetinavcov, pp. 217-219. In: X. Limnologická konferencia, Zborník referátov, Slov. a Čes. limnol. spol., Stará Turá.
[20] Šporka, F. & Krno, I. 1995. Zmeny v bentickej faune hlavného toku a vôd ležiacich v inundácii po sprevádzkovaní VD Gabčíkovo, pp.132-143. In: Výsledky a skúsenosti z monitorovania bioty územia ovplyvneného vodným dielom Gabčíkovo, Ústav zoológie a ekosozológie SAV, Bratislava.
[21] Valúchová, M. & Kanala, A. 1995. Vývoj akosti vody v Dunaji od roku 1975. Medzinár. konfer. Ekológia Dunaja, Stupava, pp.152-165.
TABLES
Tab. 1: Survey of the sampling sites of the Danube monitoring programme.
|
Locality |
River km |
Sampling site specification and period |
|
Bratislava |
1869.2 |
Middle (1989-1997) |
|
Rajka |
1848.0 |
Right bank (1989-1997) |
|
Hrušov |
1842.0 |
Left bank (1989-1997) |
|
Medveďov/Vámosszabadi |
1806.2 |
Middle (1989-1997) |
|
Komárom/Komárno |
1768.0 |
Middle (1989-1997) |
|
Szob |
1707.0 |
Left- and right banks, middle (1989-1997) |
|
Visegrád |
1690.0 |
Middle (1992-1997) |
Tab.2. Statistical values (90 percentiles) of suspended solids levels (mg.l-1 ) along the Danube (BS - Bratislava, RAJ - Rajka, HRU - Hrušov, MED - Medveďov/Vámosszabadi, KOM - Komárno/Komárom, SS - Szob middle, VIS - Visegrád) during the nine year monitoring.
|
1989 |
1990 |
1991 |
1992 |
1993 |
1994 |
1995 |
1996 |
1997 |
|
|
BS |
55,9 |
61,4 |
22,6 |
50,2 |
39,7 |
36,8 |
77,2 |
43,2 |
42,5 |
|
RAJ |
69,9 |
79,6 |
17,4 |
57,8 |
31,4 |
38,2 |
78,0 |
31,2 |
32,6 |
|
HRU |
76,2 |
80,4 |
23,6 |
54,8 |
35,4 |
26,8 |
45,6 |
33,6 |
28,8 |
|
MED |
77,5 |
71,6 |
77,0 |
66,8 |
41,2 |
36,8 |
48,0 |
38,2 |
30,8 |
|
KOM |
76,7 |
86,8 |
23,8 |
56,0 |
31,2 |
36,8 |
64,6 |
42,0 |
36,0 |
|
SS |
45,8 |
76,2 |
26,0 |
47,8 |
31,4 |
34,1 |
56,4 |
32,6 |
25,9 |
|
VIS |
- |
- |
- |
52,4 |
32,5 |
31,4 |
63,8 |
30,2 |
30,4 |
Tab.3. Statistical values (90 percentiles) of CODCr (mg.l-1 ) along the Danube (BS - Bratislava, RAJ - Rajka, HRU - Hrušov, MED - Medveďov/Vámosszabadi, KOM - Komárno/Komárom, SS - Szob middle, VIS - Visegrád) during the nine year monitoring.
|
1989 |
1990 |
1991 |
1992 |
1993 |
1994 |
1995 |
1996 |
1997 |
|
|
BS |
20,72 |
20,24 |
19,56 |
17,36 |
16,28 |
15,06 |
18,10 |
19,16 |
15,91 |
|
RAJ |
19,60 |
19,04 |
16,04 |
17,36 |
15,92 |
13,36 |
13,72 |
13,76 |
14,04 |
|
HRU |
21,20 |
20,00 |
16,30 |
13,86 |
15,81 |
14,34 |
13,34 |
14,10 |
12,70 |
|
MED |
16,63 |
16,00 |
16,00 |
15,40 |
16,33 |
16,22 |
14,16 |
13,98 |
13,90 |
|
KOM |
21,32 |
18,00 |
14,72 |
17,98 |
16,63 |
15,48 |
16,72 |
16,12 |
14,18 |
|
SS |
20,00 |
21,80 |
17,80 |
17,84 |
15,92 |
14,80 |
14,76 |
17,44 |
15,63 |
|
VIS |
|
|
|
18,10 |
16,12 |
15,18 |
15,88 |
18,34 |
16,92 |
Tab.4. Statistical values (90 percentiles) of CODCr (mg.l-1 ) in cross section of the Danube in Szob (SL - Szob left, SS - Szob middle, SP - Szob right) during the nine year monitoring.
|
|
1989 |
1990 |
1991 |
1992 |
1993 |
1994 |
1995 |
1996 |
1997 |
|
SL |
24,0 |
23,7 |
19,2 |
19,6 |
20,0 |
18,1 |
18,7 |
24,7 |
17,7 |
|
SS |
20,0 |
21,8 |
17,8 |
17,8 |
15,9 |
14,8 |
14,8 |
17,4 |
15,6 |
|
SP |
19,6 |
18,7 |
16,3 |
20,5 |
18,0 |
15,9 |
15,5 |
18,0 |
15,8 |
Tab.5. Statistical values (90 percentiles) of P-PO4 (mg.l-1 ) along the Danube (BS - Bratislava, RAJ - Rajka, HRU - Hrušov, MED - Medveďov/Vámosszabadi, KOM - Komárno/Komárom, SS - Szob middle, VIS - Visegrád) during the nine year monitoring.
|
1989 |
1990 |
1991 |
1992 |
1993 |
1994 |
1995 |
1996 |
1997 |
|
|
BS |
0,153 |
0,156 |
0,174 |
0,100 |
0,076 |
0,090 |
0,106 |
0,106 |
0,059 |
|
RAJ |
0,163 |
0,160 |
0,148 |
0,122 |
0,076 |
0,076 |
0,096 |
0,100 |
0,060 |
|
HRU |
0,186 |
0,180 |
0,144 |
0,126 |
0,080 |
0,080 |
0,098 |
0,090 |
0,070 |
|
MED |
0,193 |
0,150 |
0,154 |
0,116 |
0,076 |
0,080 |
0,108 |
0,090 |
0,066 |
|
KOM |
0,156 |
0,146 |
0,144 |
0,112 |
0,080 |
0,090 |
0,104 |
0,120 |
0,080 |
|
SS |
0,192 |
0,150 |
0,132 |
0,090 |
0,080 |
0,090 |
0,090 |
0,080 |
0,087 |
|
VIS |
|
|
|
0,106 |
0,080 |
0,090 |
0,086 |
0,096 |
0,086 |
Tab.6. Statistical values (90 percentiles) of total phosphorus (mg.l-1 ) along the Danube (BS - Bratislava, RAJ - Rajka, HRU - Hrušov, MED - Medveďov/Vámosszabadi, KOM - Komárno/Komárom, SS - Szob middle, VIS - Visegrád) during the nine year monitoring.
|
1989 |
1990 |
1991 |
1992 |
1993 |
1994 |
1995 |
1996 |
1997 |
|
|
BS |
0,312 |
0,302 |
0,240 |
0,280 |
0,160 |
0,150 |
0,156 |
0,184 |
0,146 |
|
RAJ |
0,328 |
0,296 |
0,288 |
0,210 |
0,156 |
0,136 |
0,130 |
0,136 |
0,126 |
|
HRU |
0,299 |
0,336 |
0,250 |
0,260 |
0,170 |
0,136 |
0,126 |
0,128 |
0,142 |
|
MED |
0,371 |
0,308 |
0,254 |
0,264 |
0,180 |
0,142 |
0,140 |
0,128 |
0,130 |
|
KOM |
0,303 |
0,296 |
0,298 |
0,240 |
0,163 |
0,156 |
0,146 |
0,158 |
0,126 |
|
SS |
|
0,254 |
0,231 |
0,224 |
0,180 |
0,200 |
0,150 |
0,166 |
0,137 |
|
VIS |
|
|
|
0,262 |
0,170 |
0,188 |
0,146 |
0,232 |
0,152 |
Tab.7. Statistical values (90 percentiles) of N-NO3 (mg.l-1 ) along the Danube (BS - Bratislava, RAJ - Rajka, HRU - Hrušov, MED - Medveďov/Vámosszabadi, KOM - Komárno/Komárom, SS - Szob middle, VIS - Visegrád) during the nine year monitoring.
|
1989 |
1990 |
1991 |
1992 |
1993 |
1994 |
1995 |
1996 |
1997 |
|
|
BS |
2,40 |
2,95 |
3,19 |
3,41 |
3,20 |
3,43 |
3,25 |
3,96 |
3,14 |
|
RAJ |
2,42 |
2,90 |
3,29 |
3,33 |
2,86 |
3,22 |
3,13 |
3,47 |
2,95 |
|
HRU |
2,47 |
3,08 |
3,40 |
3,49 |
3,13 |
3,33 |
3,02 |
3,19 |
2,77 |
|
MED |
2,33 |
3,06 |
3,34 |
3,90 |
3,02 |
3,41 |
3,16 |
3,37 |
2,99 |
|
KOM |
2,41 |
2,96 |
3,35 |
3,47 |
2,95 |
3,49 |
3,46 |
3,90 |
3,31 |
|
SS |
2,90 |
3,43 |
3,89 |
3,30 |
3,29 |
3,94 |
3,15 |
3,82 |
3,26 |
|
VIS |
|
|
|
3,42 |
3,25 |
3,70 |
3,10 |
3,66 |
3,16 |
Tab.8. Statistical values (90 percentiles) of total nitrogen (mg.l-1 ) along the Danube (BS - Bratislava, RAJ - Rajka, HRU - Hrušov, MED - Medveďov/Vámosszabadi, KOM - Komárno/Komárom, SS - Szob middle, VIS - Visegrád) during the nine year monitoring.
|
1989 |
1990 |
1991 |
1992 |
1993 |
1994 |
1995 |
1996 |
1997 |
|
|
BS |
3,36 |
4,39 |
4,87 |
4,92 |
4,35 |
4,54 |
4,02 |
4,78 |
4,05 |
|
RAJ |
3,52 |
4,27 |
4,98 |
4,59 |
3,91 |
4,72 |
4,02 |
4,17 |
3,41 |
|
HRU |
3,66 |
4,47 |
4,94 |
5,03 |
4,15 |
4,55 |
3,89 |
3,85 |
3,40 |
|
MED |
3,61 |
4,72 |
4,75 |
4,92 |
3,98 |
4,87 |
4,02 |
4,13 |
3,56 |
|
KOM |
3,31 |
4,39 |
4,81 |
4,63 |
4,07 |
5,00 |
4,45 |
4,91 |
3,93 |
|
SS |
|
3,20 |
|
4,40 |
4,29 |
4,71 |
3,97 |
4,43 |
3,79 |
|
VIS |
|
|
|
4,39 |
4,45 |
4,26 |
3,72 |
4,39 |
3,71 |
Tab.9. Statistical values (90 percentiles) of oils-petroleum hydrocarbons-UV (mg.l-1 ) along the Danube (BS - Bratislava, RAJ - Rajka, HRU - Hrušov, MED - Medveďov/Vámosszabadi, KOM - Komárno/Komárom, SS - Szob middle, VIS - Visegrád) during the nine year monitoring.
|
1989 |
1990 |
1991 |
1992 |
1993 |
1994 |
1995 |
1996 |
1997 |
|
|
BS |
0,054 |
0,040 |
0,082 |
0,036 |
0,020 |
0,060 |
0,080 |
0,080 |
0,100 |
|
RAJ |
0,046 |
0,050 |
0,146 |
0,040 |
0,026 |
0,060 |
0,060 |
0,080 |
0,076 |
|
HRU |
0,053 |
0,060 |
0,112 |
0,030 |
0,030 |
0,060 |
0,076 |
0,080 |
0,112 |
|
MED |
0,043 |
0,050 |
0,044 |
0,066 |
0,026 |
0,060 |
0,060 |
0,080 |
0,066 |
|
KOM |
0,050 |
0,040 |
0,034 |
0,040 |
0,040 |
0,070 |
0,096 |
0,090 |
0,100 |
|
SS |
0,096 |
0,191 |
0,078 |
0,050 |
0,060 |
0,047 |
0,036 |
0,056 |
0,044 |
|
VIS |
|
|
|
0,050 |
0,056 |
0,056 |
0,030 |
0,058 |
0,040 |
Tab.10. Statistical values (90 percentiles) of saprobic index of bioseston along the Danube (BS - Bratislava, RAJ - Rajka, HRU - Hrušov, MED - Medveďov/Vámosszabadi, KOM - Komárno/Komárom, SS - Szob middle, VIS - Visegrád) during the nine year monitoring.
|
1989 |
1990 |
1991 |
1992 |
1993 |
1994 |
1995 |
1996 |
1997 |
|
|
BS |
2,72 |
2,61 |
2,37 |
2,40 |
2,41 |
2,44 |
2,36 |
2,34 |
2,40 |
|
RAJ |
2,50 |
2,61 |
2.32 |
2,47 |
2,43 |
2,43 |
2,35 |
2,39 |
2,40 |
|
HRU |
2,41 |
2,59 |
2,45 |
2,36 |
2,46 |
2,43 |
2,35 |
2,41 |
2,37 |
|
MED |
2,45 |
2,54 |
2,37 |
2,39 |
2,37 |
2,39 |
2,38 |
2,34 |
2,34 |
|
KOM |
2,69 |
2,58 |
2,30 |
2,45 |
2,44 |
2,44 |
2,34 |
2,45 |
2,40 |
|
SS |
2,60 |
2,60 |
2,54 |
2,41 |
2,36 |
2,37 |
2,35 |
2,44 |
2,37 |
|
VIS |
|
|
|
2,46 |
2,38 |
2,39 |
2,38 |
2,39 |
2,39 |
Tab.11. Statistical values (90 percentiles) of coliform bacteria (CFU.lml-1 ) along the Danube (BS - Bratislava, RAJ - Rajka, HRU - Hrušov, MED - Medveďov/Vámosszabadi, KOM - Komárno/Komárom, SS - Szob middle, VIS - Visegrád) during the nine year monitoring.
|
1989 |
1990 |
1991 |
1992 |
1993 |
1994 |
1995 |
1996 |
1997 |
|
|
BS |
190 |
194 |
116 |
342 |
400 |
278 |
240 |
212 |
175 |
|
RAJ |
791 |
366 |
229 |
1008 |
344 |
178 |
250 |
125 |
66 |
|
HRU |
536 |
456 |
189 |
1008 |
298 |
160 |
146 |
150 |
61 |
|
MED |
467 |
408 |
167 |
350 |
127 |
126 |
66 |
45 |
43 |
|
KOM |
75 |
60 |
33 |
52 |
75 |
49 |
38 |
38 |
57 |
|
SS |
521 |
348 |
134 |
534 |
434 |
448 |
824 |
422 |
450 |
|
VIS |
|
|
|
372 |
416 |
318 |
358 |
296 |
206 |
Tab.12. Limits for water quality classification
|
parameter/class |
dimension |
I. |
II. |
III. |
IV. |
V. |
VI. |
|
Temperature |
O C |
<20 |
25 |
25 |
30 |
30 |
>30 |
|
Suspended solids |
mg.l-1 |
20 |
30 |
50 |
100 |
200 |
>200 |
|
pH |
|
6,5-8 |
6,5-8,5 |
6,5-8,6 |
6-8,5 |
6-8,5 |
6,9-9,0 |
|
Dissolved Oxygen |
mg.l-1 |
>8 |
6 |
5 |
4 |
2 |
<2 |
|
COD-Mn |
mg.l-1 |
<5 |
10 |
20 |
30 |
40 |
>40 |
|
COD-Cr |
mg.l-1 |
<15 |
25 |
50 |
70 |
100 |
>100 |
|
BOD-5 |
mg.l-1 |
<2 |
4 |
8 |
15 |
25 |
>25 |
|
TOC |
mg.l-1 |
<3 |
6 |
8 |
12 |
20 |
>20 |
|
Conductivity |
μS.cm-1 |
<400 |
700 |
1100 |
1300 |
1600 |
>1600 |
|
Total mineralization |
mg.l-1 |
<300 |
500 |
800 |
1000 |
1200 |
>1200 |
|
Alcalinity |
mmol.l-1 |
>2 |
2,0-1,0 |
1-0,2 |
0,2-0,1 |
<0.1 |
|
|
Hardness |
G.deg |
<15 |
20 |
30 |
40 |
50 |
>50 |
|
Chloride |
mg.l-1 |
<50 |
150 |
200 |
300 |
500 |
>500 |
|
Sulphate |
mg.l-1 |
<50 |
150 |
200 |
300 |
400 |
>400 |
|
N-NH4 |
mg.l-1 N |
<0,1 |
0,2 |
0,5 |
2,0 |
5,0 |
>5,0 |
|
N-NO2 |
mg.l-1 N |
<0,002 |
0,005 |
0,02 |
0,05 |
0,1 |
>0,1 |
|
N-NO3 |
mg.l-1 N |
<1 |
3 |
5 |
10 |
20 |
>20 |
|
Total Nitrogen |
mg.l-1 N |
<0,3 |
0,75 |
1,5 |
2,5 |
>2,2 |
|
|
P-PO4 |
mg.l-1 P |
<0,008 |
0,065 |
0,16 |
0,33 |
0.65 |
>0,65 |
|
Total Phosphorus |
mg.l-1 P |
<0,016 |
0,13 |
0,33 |
0,65 |
0.98 |
>0,98 |
|
Phenols |
mg.l-1 |
<0,002 |
0,01 |
0,05 |
0,1 |
1,0 |
>1,0 |
|
Anionactive surfactants |
mg.l-1 |
0,0 |
<0,5 |
1,0 |
2,0 |
3,0 |
>3,0 |
|
Petroleum hydrocarbons (UV) |
mg.l-1 |
0 |
<0.05 |
0,10 |
0,3 |
1,0 |
1,0 |
|
Lindane |
μg.l-1 |
0 |
0 |
<0.08 |
2,0 |
>2.0 |
|
|
Polychlorinated biphenyls (PCBs) |
μg.l-1 |
0 |
0 |
<0.001 |
2,0 |
>2,0 |
|
|
Iron |
mg.l-1 |
<0,5 |
1 |
2 |
5 |
10 |
>10 |
|
Manganese |
mg.l-1 |
<0,005 |
0,1 |
0,3 |
0,8 |
1,5 |
>1,5 |
|
Zinc |
mg.l-1 |
<0,2 |
1 |
2 |
5 |
10 |
>10 |
|
Copper |
μg.l-1 |
<20 |
50 |
100 |
200 |
500 |
>500 |
|
Chromium |
μg.l-1 |
<20 |
50 |
100 |
200 |
500 |
>500 |
|
Lead |
μg.l-1 |
<10 |
20 |
50 |
100 |
200 |
>200 |
|
Cadmium |
μg.l-1 |
<3 |
5 |
10 |
20 |
30 |
>30 |
|
Mercury |
μg.l-1 |
<0,1 |
0,2 |
0,5 |
1 |
5 |
>5 |
|
Nickel |
μg.l-1 |
<20 |
50 |
100 |
200 |
500 |
>500 |
|
Arsenic |
μg.l-1 |
<10 |
20 |
50 |
100 |
200 |
>200 |
|
Saprobic index |
|
1 |
1,5 |
2,5 |
3,5 |
4 |
>4,0 |
|
Chlorophyll-a |
mg.m-3 |
<10 |
35 |
75 |
180 |
250 |
>250 |
|
Coliform bacteria |
i.ml-1 |
0,1 |
1 |
10 |
100 |
1000 |
>1000 |
|
Faecal Coliforms |
CFU.ml-1 |
<0,1 |
0,1-0,3 |
0,3-1 |
1,0-10 |
>10 |
|
|
Faecal Streptococci |
CFU.ml-1 |
<0,1 |
0,3 |
1 |
10 |
>10 |
|
Note:
The value of 90 percentile was used for classification
The mean value was used for classification
Figures
|
||||
| Fig.1. Statistical values (90 percentiles) of pH along the Danube (BS - Bratislava, RAJ - Rajka, HRU - Hrušov, MED - Medveďov/Vámosszabadi, KOM - Komárno/Komárom, SS - Szob middle, VIS - Visegrád) during the nine year monitoring. | ||||
|
||||
| Fig. 2. C90% of BOD5 (mg.l-1) along the Danube (BS - Bratislava, RAJ - Rajka, HRU - Hrušov, MED - Medveďov/Vámosszabadi, KOM - Komárno/Komárom, SS - Szob middle, VIS - Visegrád) during the nine year monitoring. | ||||
|
|
||||
| Fig. 3. Statistical values (90 percentiles) of CODMn (mg.l-1) in cross section in the Danube at Szob (SL - Szob left, SS - Szob middle, SP - Szob right) during the nine year monitoring | ||||
|
|
|
|
||
| Fig.4. Time series and trend line of the P-PO4 for selected sampling sites. | Fig.5. Time series and trend lines of oils (petroleum hydrocarbons-UV) in Bratislava, Komárno/Komárom and Szob. | Fig. 6. Time series and trend lines of the total beta activity in selected sampling sites. | ||
|
|
|
|
||
| Fig.7. Time series and trend lines of the psychrophylic bacteria in selected sampling sites. | Fig. 8. Time series and trend lines of saprobic index of bioseston at Bratislava, Medveďov/Vámosszabadi, Komárno/Komárom and Szob middle. | Fig.9. Time series and trend lines of the zooplankton abundancy (ind.100 l-1) in selected sampling sites. | ||
![]()